Getting Started with Business Central Insights

Welcome to your Business Central Insights introduction guide. This user manual is tailored to focus on Power BI features that are relevant and beneficial for users of the Business Central Insights apps.
After completing this manual, you can further enhance your knowledge with the following tutorials:
Explore the capabilities of Business Central Insights AI Visuals
Master the art of analyzing Business Central Insights Data in Excel
Access a curated list of standard Power BI measure abbreviations and naming conventions here.
For an in-depth understanding and advanced techniques in Power BI, explore the Microsoft Learn courses. These resources provide valuable insights and hands-on experiences.
Additionally, the Business Central Insights help page offers further information and updates.
Accessing Power BI Reports
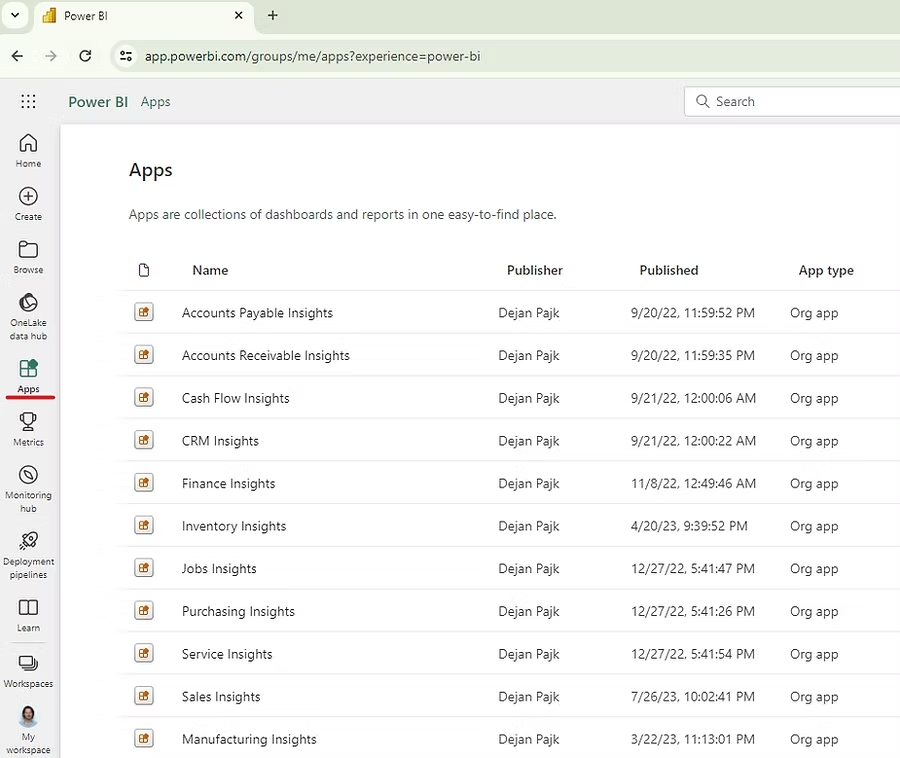
To start, open Power BI, then choose the 'Apps' menu. From there, select and click on the specific App you wish to open.
Open 'Sales Insights' app.
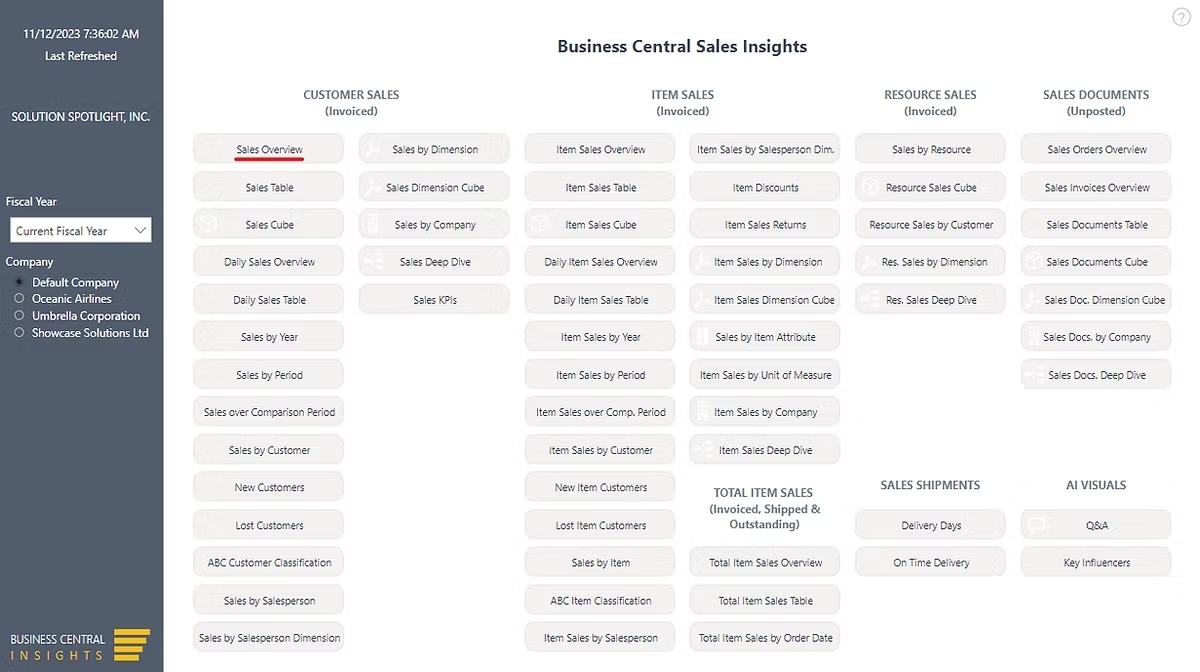
Home Page Overview
Each app's Home page is your central hub. It includes a menu to access all report pages and the option to select and set a default company. For instance, in our example, "Solution Spotlight, Inc" is the default. Set your default at Company Setup.
Open 'Sales Overview' report.
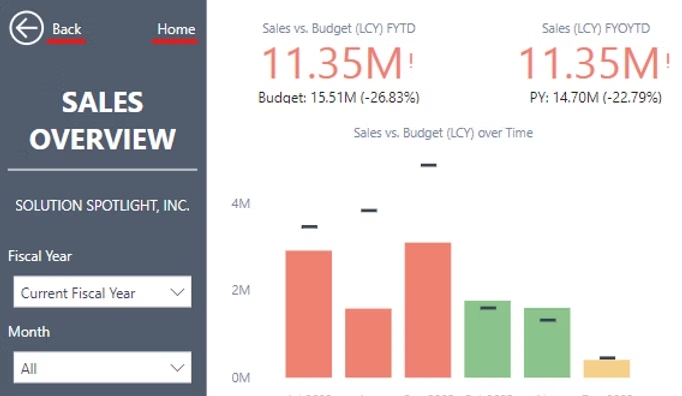
Remember, the Home and Back buttons on report pages facilitate easy navigation, leading you to the Home page or the previous report, respectively.
Filtering Data
Power BI offers three primary methods to filter data:
Slicers - Find these in the left-hand menu on most report pages, allowing you to filter by Fiscal Year, Month, and Global Dimensions.
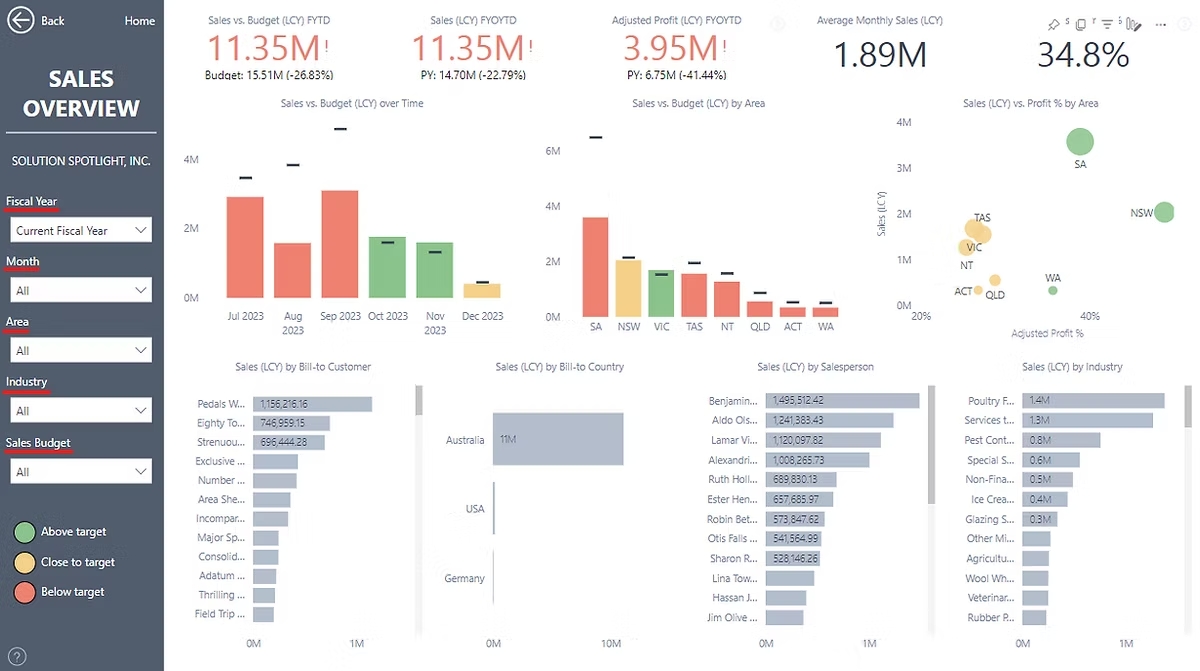
Filters Pane - Located on the right, lets you filter reports by any field or attribute. Find more about the Filters pane here.
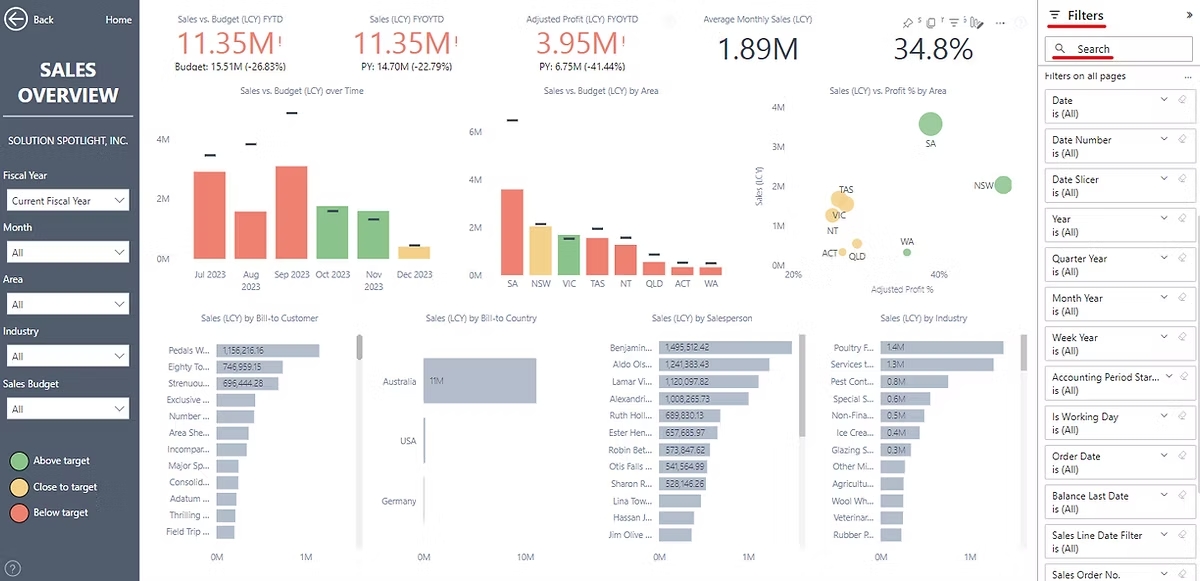
If you can't find a specific filter, please don''t hesitate to get in touch with us, and we'll ensure it's included in our upcoming product updates.
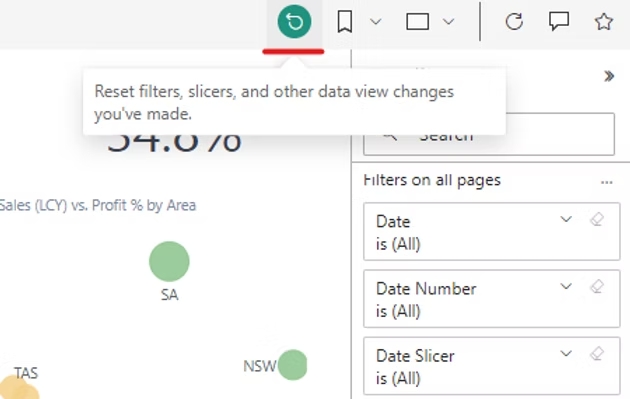
To reset the Filters pane to the defaults, select the Reset icon from the top-right menu bar.
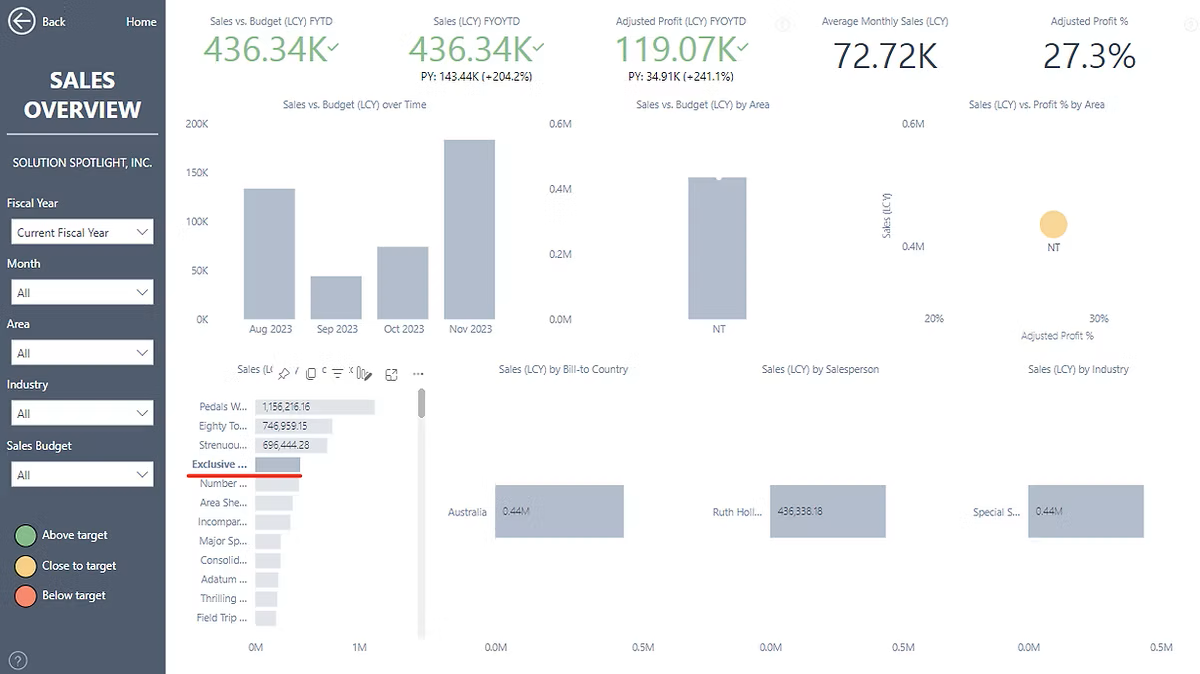
Cross-filtering - Enhance interactivity between visuals. For instance, selecting 'Customer' in a 'Sales by Bill-to Customer' chart automatically applies this filter across all visuals on that page. You can select multiple items simultaneously using the CTRL (Windows) or Command (Mac) + click. Find more information about the cross-filtering here.
Drill down and up
When a visual contains multiple layers of detail, it allows for interactive exploration between these levels. To effectively navigate through the intricacies of your data, it''s essential to understand and use the drill-down, drill-up, and expand functions embedded in your visuals.
These functions are represented by four key drill icons, each serving a unique purpose in data exploration:
![]()
Drill-up (Upward-Pointing Arrow): Use the drill-up icon to ascend one level in your data hierarchy.
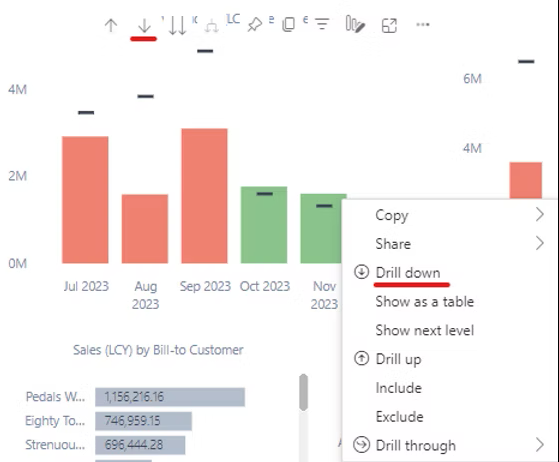
Drill-down One Field at a Time (Downward-Pointing Arrow): Activate this feature by selecting the icon with a single downward arrow, which is highlighted by a grey background when active. This allows you to explore your data one field at a time, moving progressively deeper into the details.
Drill-down All Fields at Once (Two Downward-Pointing Arrows): This icon enables you to move down to the next level of your data hierarchy in a comprehensive manner, encompassing all related fields simultaneously.
Expand All Down One Level in the Hierarchy: The Expand function adds an additional layer to your current hierarchical view, broadening the scope of the displayed data.
For instance, the current visual displays Sales vs. Budget by Month. To view weekly figures for November 2023, you can either right-click on the November 2023 column and choose 'Drill Down', or achieve the same effect by first clicking on the drill-down icon (marked by a downward-pointing arrow) and then selecting the November 2023 column.
Find more information about the Drill mode in a Power BI visual here.
Drill through
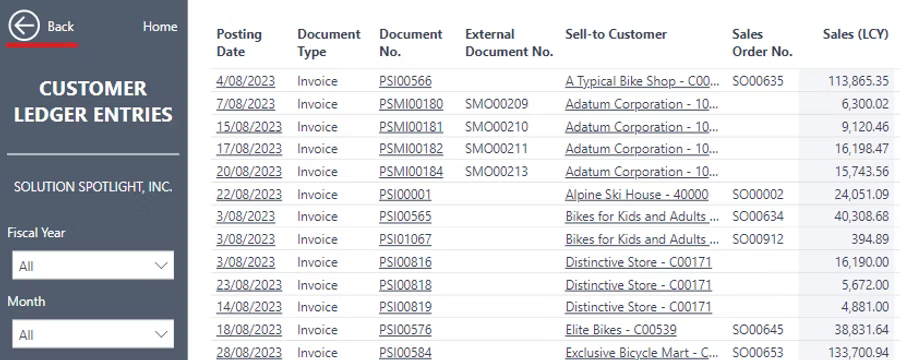
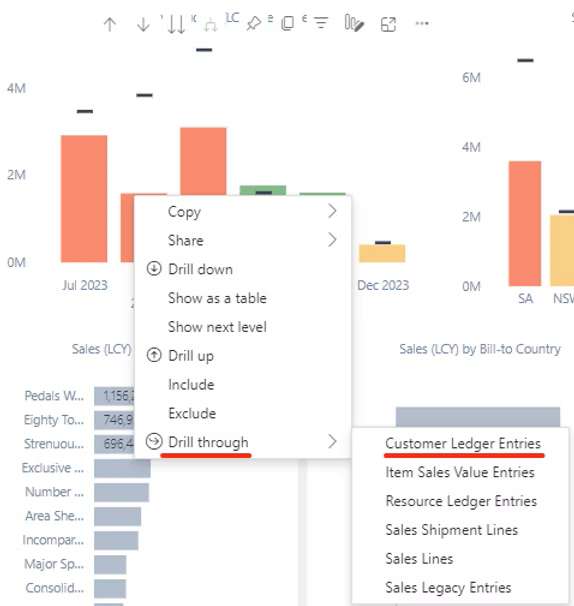
To find detailed information about specific values, you can use the Drill through. For example, to find all the sales transactions that were posted in August, right click on the appropriate column and select Drill through > Customer Ledger Entries.
The Customer Ledger Entries page will open, filtered by August 2023.
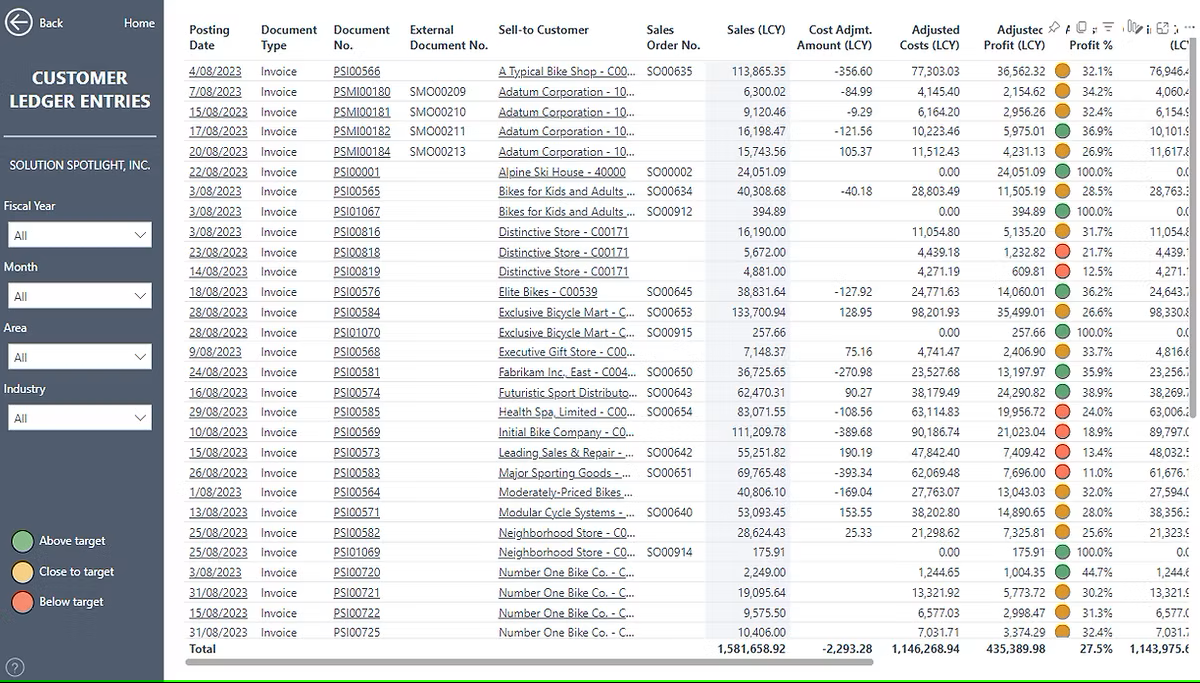
On the drill through pages, look for underlined values. These are interactive links. A simple click on any of these underlined values will directly open the corresponding document or ledger entries in Business Central. See more details here.
To return to the previous page, select the Back button in the top left corner.